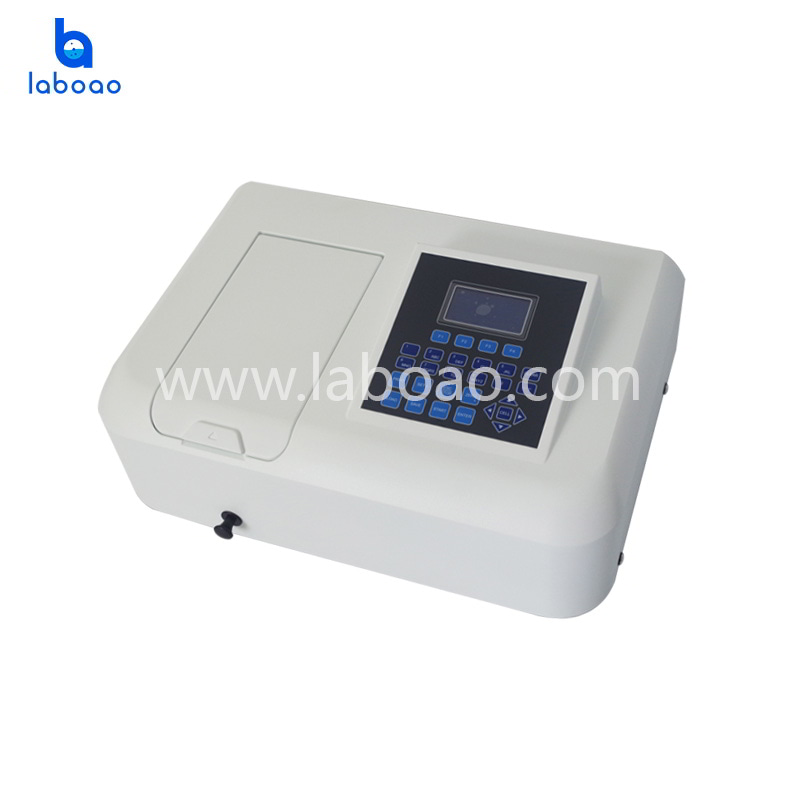
Core Principles And Selection Of UV-Vis Spectrophotometers
I. Working Principle
The core operational process of a UV-Vis spectrophotometer involves four stages: light source emission, monochromatization, sample absorption, and photoelectric conversion:
1. Light Source System: The instrument is typically equipped with two light sources. A deuterium lamp emits a continuous UV spectrum (190–350 nm) for UV-range detection, while a tungsten or tungsten-halogen lamp emits a continuous visible spectrum (350–900 nm) for visible-range detection. A switching mirror toggles between the sources to ensure coverage of the entire wavelength range.
2. Monochromator: Composite light enters the monochromator through an entrance slit, is collimated into a parallel beam, and is projected onto a dispersive element (usually a holographic grating or prism). The grating spatially separates light of different wavelengths via diffraction, and the exit slit isolates a single wavelength (monochromatic light). Slit width directly determines spectral bandwidth, thereby influencing resolution.
3. Sample Compartment and Absorption: The monochromatic light is split into two paths: one passes through a reference cell (usually containing a blank solvent), and the other passes through a sample cell. Molecules or ions within the sample selectively absorb photons of specific energies, triggering electronic transitions (such as n→π* or π→π* transitions) and resulting in a reduction of transmitted light intensity.
4. Detection and Signal Processing: Light transmitted through the sample is converted into electrical signals by a photoelectric converter (such as a photomultiplier tube [PMT] or a silicon photodiode array). A logarithmic amplifier converts the light intensity signal into an absorbance value (A = log(I₀/I)); after analog-to-digital conversion, the data is transmitted to a computer system to plot absorption spectra or output quantitative data.
II. Purchasing Guide
It is recommended to evaluate options based on the following criteria:
1. Optical System Type: Single-beam systems feature a simple structure and high light throughput, making them suitable for routine testing where budgets are limited and stability requirements are moderate. Double-beam systems can compensate for light source fluctuations and drift in real-time, making them ideal for high-precision, long-duration analyses.
2. Wavelength Range and Accuracy: Determine the required wavelength range based on testing needs (typically 190–1100 nm; specialized applications may require extension beyond 1100 nm). Wavelength accuracy (typically ±0.1–0.5 nm) is a critical specification that directly impacts the reliability of qualitative analysis.
3. Spectral Bandwidth: A narrower bandwidth yields higher resolution but reduces light intensity. A bandwidth of 2–5 nm is sufficient for general analysis; however, if resolving overlapping spectra (e.g., multi-component pharmaceutical analysis) is required, an instrument with a bandwidth of 1 nm or less is recommended.
4. Stray Light Level: Stray light causes measured absorbance values for high-concentration samples to appear lower than actual values (deviating from the Beer-Lambert Law). High-quality instruments should exhibit stray light levels below 0.01% T (transmittance) at 340 nm.
5. Photometric Accuracy and Noise: Photometric accuracy (typically ±0.002–0.005 Abs) determines quantitative precision, while photometric noise affects the lower limit of detection.
6. Sample Compartment Versatility: Ensure the sample compartment accommodates various cuvette types (micro-volume, long path-length, flow cells) and supports accessories such as autosamplers or integrating spheres to meet future functional expansion needs.
7. Software and Data Compliance: The software should support functions such as spectral scanning, quantitative analysis (standard curve method, coefficient method), and kinetic analysis. For pharmaceutical or testing organizations, compliance with GLP/GMP standards—such as tiered user access, audit trails, and electronic signatures—is essential.
8. Brand and Service: Prioritize brands that provide original manufacturer calibration certificates, periodic wavelength/photometer calibration services, and professional technical support to ensure the instrument maintains stable performance throughout its entire lifecycle.
PreviousCauses And Countermeasures For Air Ingress In Vacuum Freeze-Dryer Vacuum Pumps
NextWorking Principle And Liquid Film Formation Conditions Of Falling Film Evaporators